

Supplier price changes can significantly impact profitability, often with even small adjustments causing ripple effects across operations. In 2023, global inventory distortion reached $1.77 trillion, with stockouts alone leading to 4% sales losses for every $1 billion in revenue. To manage such risks, businesses are turning to scenario-based forecasting, a method that evaluates multiple "what-if" scenarios – like a 10% spike in raw material costs – rather than relying on single-point predictions.
Key insights include:
- Scenario-based forecasting helps businesses prepare for base, optimistic, and pessimistic outcomes.
- AI-powered tools reduce forecasting errors by 20–50%, cutting lost sales by up to 65%.
- A should-cost model breaks down supplier quotes into material, labor, and production costs, enabling data-driven negotiations.
- Steps to improve forecasting include reviewing historical spend data, identifying key cost drivers, building cost models, and testing scenarios.
- Tools like QSTRAT streamline data integration, automate RFQs, and provide real-time market insights.
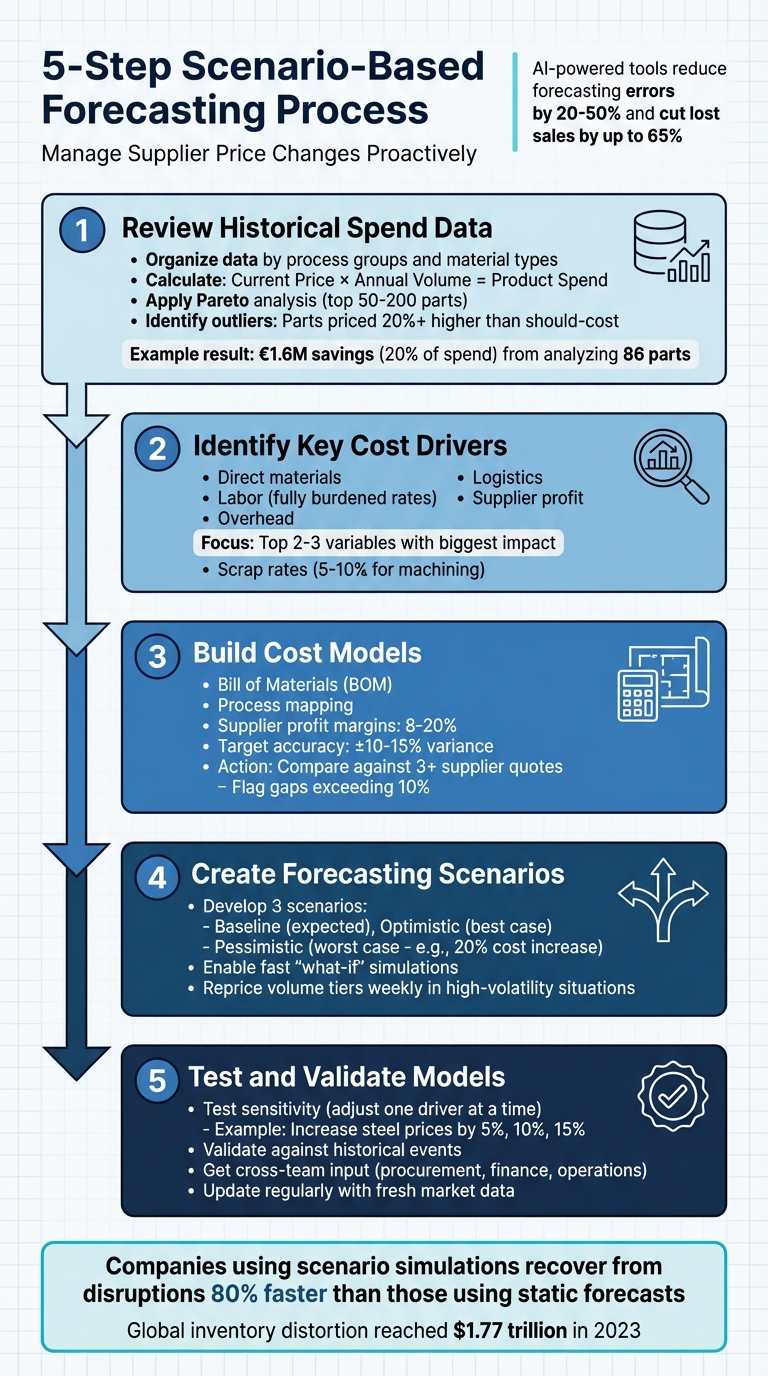
5-Step Scenario-Based Forecasting Process for Supplier Price Management
Checklist for Scenario-Based Forecasting
Step 1: Review Historical Spend Data
Start by organizing procurement data by process groups and material types to pinpoint cost outliers. Calculate total product spend using the formula: Current Price of Part × Estimated Annual Volume = Product Spend. Then, apply Pareto analysis to focus on the top 50, 100, or 200 parts with the highest annual procurement spend.
Here’s an example: In November 2024, a $6.5 billion commercial truck and diesel engine manufacturer analyzed €7.7 million in spend across 86 sheet metal parts. By identifying 17 outliers through spend and should-cost analysis, they confirmed savings of €1.6 million – about 20% of the analyzed spend.
To ensure accuracy, gather detailed documents like 3D CAD models, 2D drawings, PO history, and batch sizes. Identify cost outliers by comparing historical spend to should-cost estimates. A typical outlier is any part priced 20% higher than its estimated should-cost.
Consolidate data from ERP, SRM, and PLM systems to avoid manual errors. Enrich historical data with market benchmarks, supplier interviews, and real-time commodity price feeds. Additionally, analyze seasonality to uncover recurring cycles or pricing patterns for specific goods or services.
Once historical data is in order, move on to identifying the key cost drivers.
Step 2: Identify Key Cost Drivers
Break down product costs into categories like direct materials, labor, overhead, logistics, and supplier profit. External variables such as commodity price shifts, regional labor rates, currency exchange fluctuations, and tariffs are also critical.
A helpful approach is to plot cost versus weight. A high cost-to-weight ratio often signals complexity or tight tolerances. Focus on the top 2–3 variables – such as a specific raw material or energy cost – that have the biggest impact on high-spend items.
For labor costs, use fully burdened labor rates that include benefits, payroll taxes, insurance, and regional premiums. For material costs, factor in the scrap rate (e.g., machining aluminum may require a 5–10% scrap allowance) to avoid underestimating expenses.
Since commodity prices can change quickly, relying on outdated estimates could hurt negotiations. Use live data to stay current. Supplement internal ERP data with external benchmarks from sources like Bloomberg or IHS Markit to track real-time cost fluctuations.
Armed with this information, ask targeted questions like: "Our model shows material costs at $15 based on market rates. Can you explain your material choice?".
These insights set the foundation for building accurate cost models.
Step 3: Build Cost Models
A strong should-cost model includes elements like direct materials (with scrap and yield), fully burdened labor, manufacturing overhead, logistics, and supplier profit margins, which typically range from 8% to 20% depending on industry complexity.
To build this model, deconstruct the product into a Bill of Materials (BOM) and process map. Gather intelligence on cost drivers and sum these components to create a fact-based benchmark. Keep raw cost inputs separate to allow for easy updates.
Platforms like QSTRAT (https://qstrat.com) combine historical and real-time data for precise forecasting. With high-quality data, you can achieve a variance of ±10–15% from actual costs.
Compare your should-cost model against at least three supplier quotes. If gaps exceed 10%, this often indicates incorrect assumptions about process complexity or material grade. Don’t forget to include scrap allowances and yield factors in your material cost calculations.
Use your cost models to create dynamic forecasting scenarios.
Step 4: Create Forecasting Scenarios
Develop three scenarios – baseline, optimistic, and pessimistic – based on key cost drivers. This helps procurement teams weigh the trade-offs between cost and risk.
For instance, in a pessimistic scenario, simulate a 20% supplier cost increase to evaluate its impact on EBITDA or breakeven thresholds.
Use the cost models from Step 3 to quickly run these scenarios. Automated platforms with live market inputs enable fast, repeatable "what-if" simulations. Reprice volume tiers regularly – weekly or even daily in high-volatility situations – to spot margin erosion before it affects the business.
Step 5: Test and Validate Models
Test your models’ sensitivity by adjusting one cost driver at a time. For example, increase steel prices by 5%, 10%, and 15% while keeping other variables constant. This helps you understand which factors have the most significant influence on total costs.
Validate your models by comparing them to historical events and seeking input from procurement, finance, and operations teams. Regularly update the models with fresh market data to keep them reliable.
sbb-itb-827f251
Using Supplier Data for Better Forecasts
Blending supplier data with your internal cost models sharpens forecasts and helps you make smarter sourcing decisions.
Assess Supplier Reliability
Looking at a supplier’s track record can reveal much more than static cost models ever could. Key metrics like on-time delivery rates, product quality, and price stability over time provide a clearer picture of which suppliers consistently meet their commitments. Geographic diversity also plays a big role. Relying on suppliers concentrated in one region can leave you vulnerable to geopolitical tensions or natural disasters that could cause sudden price spikes. Sometimes, a supplier with slightly higher unit costs but quicker delivery might save you money overall by reducing inventory holding costs. Evaluating reliability like this lays the groundwork for a deeper analysis of supplier proposals.
Compare Supplier Proposals
Don’t just go with the lowest bid – dig deeper. Break down supplier quotes into components like direct materials, labor, overhead, and profit. If a quote significantly exceeds your internal "should-cost" benchmark, investigate why. Are they using higher-grade materials or different processes? Comparing multiple proposals can help you confirm whether your cost models align with current market realities. Integrated technology tools can make this comparison process far more efficient.
Use QSTRAT for Supplier Performance Management

QSTRAT offers a centralized platform to manage sourcing events, making it easier to track supplier pricing trends over time and spot areas for improvement. Its decision-support tools let you quickly compare supplier responses side by side. Automated RFQ workflows simplify the quoting process, freeing up time for more in-depth price analysis. Plus, QSTRAT’s scenario-based modeling tools let you simulate price changes and test alternative sourcing strategies, giving you an edge in an unpredictable market.
Turn Forecast Insights into Action
Calculate Financial Impact
After building your scenarios, it’s time to quantify the cost delta – the difference between your current spending and the projected costs in each scenario. To do this, multiply your annual spend by the percentage difference between current costs and your should-cost estimates. This calculation helps pinpoint which components demand immediate attention.
Here’s an important insight: the initial purchase price usually accounts for only 20–30% of a product’s total lifetime costs. The rest comes from operating expenses, maintenance, and downtime. That’s why creating a Total Cost of Ownership (TCO) analysis is so valuable. For instance, a bulk inventory purchase in Q1 could either shield you from future price hikes or unnecessarily tie up your working capital. These financial insights are key to fine-tuning your sourcing strategies.
Apply Insights to Sourcing Strategies
Armed with your cost delta analysis, adjust your sourcing strategies to address pricing anomalies. Break down supplier quotes into key cost components – direct materials, labor, overhead, and logistics. If a quote exceeds your should-cost benchmark by 20% or more, you’ve identified an outlier worth investigating. Ask focused questions: Are they using higher-grade materials? Is their machine cycle time longer than industry norms? This transforms negotiations from simple price haggling to data-driven problem solving.
"Procurement moves from price haggling to value creation. You stop arguing totals and start collaborating on discrete cost drivers."
- Microestimates
Leverage fairly priced components as strategic concessions. Showing suppliers that you recognize fair pricing on some items makes them more likely to negotiate on true outliers. Typically, reasonable profit margins range from 5% to 20%, depending on complexity. Adding an 8–20% margin to your should-cost estimate gives you a realistic target price. This method allows you to navigate volatile markets with tailored negotiation strategies for multiple pricing scenarios.
Automate Updates and Monitoring
Automated workflows are essential for staying ahead of market changes and protecting margins. Commodity prices can shift weekly, labor costs adjust quarterly, and freight surcharges often appear without warning. Tools like QSTRAT’s platform provide real-time monitoring of supplier pricing trends and automate RFQ workflows, ensuring your cost models stay up-to-date. The system also delivers margin-safe pricing guidance to procurement and sales teams, flagging potential risks before they impact your bottom line.
Set up trigger points – specific market indicators that signal when a forecasted scenario is becoming reality. For example, you might pre-negotiate surge capacity agreements or pre-qualify alternative suppliers so you can act quickly. Research indicates that companies using scenario simulations recover from disruptions 80% faster than those relying on static, single-point forecasts. Keep your scenarios manageable – three to five per cycle (e.g., base case, upside, downside) – to capture meaningful variability without overwhelming your analysis.
Conclusion
Key Takeaways for Manufacturers
Scenario-based forecasting gives manufacturers the tools to manage supplier price changes proactively. Instead of waiting for market shifts to hit your bottom line, you can simulate various outcomes – best-case, worst-case, and neutral scenarios – to prepare for volatility. This process begins with analyzing historical spend data to identify cost outliers, followed by creating models that incorporate real-world factors like tariffs, commodity price fluctuations, and labor shortages. Interestingly, over 60% of global manufacturers have ranked scenario modeling as a top priority for 2025, highlighting its role in speeding up decision-making and protecting profit margins.
For example, by quantifying the effects of a 20% supplier price increase on your cost of goods sold (COGS), margins, and EBITDA, you can decide whether to absorb the costs, pass them along, or switch to alternative vendors. Tools like QSTRAT’s platform simplify this process by combining real-time supplier data with automated workflows, enabling procurement and finance teams to receive timely pricing insights before risks become reality.
"It’s not just about playing defense – it’s also about playing offense – finding competitive advantage by shaping a supply chain resilience strategy focused on disruption avoidance." – PWC
Proactive cost management also shifts the focus from chasing the lowest bids to forming strategic partnerships that deliver long-term value and innovation. By gaining visibility into sub-tier suppliers – where disruption risks are estimated to be 38% higher than at tier-one levels – you can pinpoint vulnerabilities and create contingency plans to prevent disruptions from rippling through your supply chain.
Armed with these insights, you can take deliberate steps to refine and strengthen your sourcing strategies.
Next Steps for Implementation
Action Steps: Translate these insights into actionable changes for your sourcing strategy.
Start by revisiting your spend data, prioritizing categories that drive the highest costs. Define clear objectives – whether it’s mitigating risks, capitalizing on market opportunities, or achieving cost savings. Engage stakeholders from procurement, finance, and operations early in the process to ensure the scenarios you develop align with practical constraints and strategic goals.
Consider investing in platforms that automate data preparation and integrate seamlessly with your existing ERP and CAD systems. Relying on manual spreadsheets can lead to outdated or incomplete information, while automated should-cost modeling can cut design iteration time from 40 hours to just a few minutes. Build in trigger points to signal when adjustments to your strategy are needed. Companies that treat scenario planning as an ongoing, adaptive process are better equipped to navigate market volatility and stay ahead of disruptions.
FAQs
What’s the difference between scenario-based forecasting and a single forecast?
Scenario-based forecasting takes a broader approach by exploring multiple potential outcomes, unlike a single forecast that zeroes in on one predicted result. By examining various "what-if" scenarios, organizations can better identify risks, evaluate uncertainties, and prepare adaptable strategies. On the other hand, a single forecast operates under the assumption of a fixed future, which can be less effective in dynamic or unpredictable markets where several outcomes might unfold.
How do I build a should-cost model if I’m missing supplier cost details?
If you can’t access supplier cost details, try breaking the product or service into its main cost components – such as materials, labor, overhead, logistics, and profit margins. Use tools like industry benchmarks, historical trends, or standard estimates to calculate each part. Once you’ve done that, combine these elements to build a detailed cost model. Over time, refine the model with updated data or by running different scenarios. This method not only helps pinpoint potential savings but also strengthens negotiation strategies and provides a clearer understanding of cost structures.
How often should I refresh scenarios when commodity prices are volatile?
When commodity prices fluctuate, it’s crucial to update scenarios regularly to stay ahead of uncertainty. Relying on static, long-term plans can leave you unprepared, as these plans may become irrelevant in just a few weeks. Frequent updates – monthly or even more often – allow businesses to respond quickly to shifts in costs, tariffs, or market conditions. This approach helps maintain accurate forecasts and supports smarter decision-making in ever-changing markets.
Related Blog Posts
You may also like

Top 7 Tools For Supplier Relationship Management
Compare seven SRM platforms by features, integrations, and scalability to find the right supplier management solution.

Supplier Certification: Why It Matters for Compliance
Supplier certification is a strategic safeguard that prevents regulatory breaches, supply disruptions, and reputational damage.