

Using historical quotes for cost estimation can save time, reduce errors, and improve accuracy. Instead of relying on guesswork, manufacturers can analyze past project data to create estimates that are typically within 5–10% of actual costs. This method helps identify cost trends, streamline quoting processes, and make better supplier decisions.
Key Takeaways:
- Data Preparation: Standardize and organize historical quotes to ensure consistency.
- Validation: Adjust for inflation, quantity differences, and anomalies to improve reliability.
- Analysis: Break down costs into key drivers (materials, labor, overhead) and use statistical methods to improve predictions.
- Implementation: Select relevant historical quotes, adjust for market conditions, and validate estimates with comparison tables.
- Technology: Modern quoting software integrates real-time data and automates analysis for faster, more accurate estimates.
Switching to a data-driven approach not only improves cost estimation but also enhances efficiency, reduces waste, and supports better supplier negotiations.
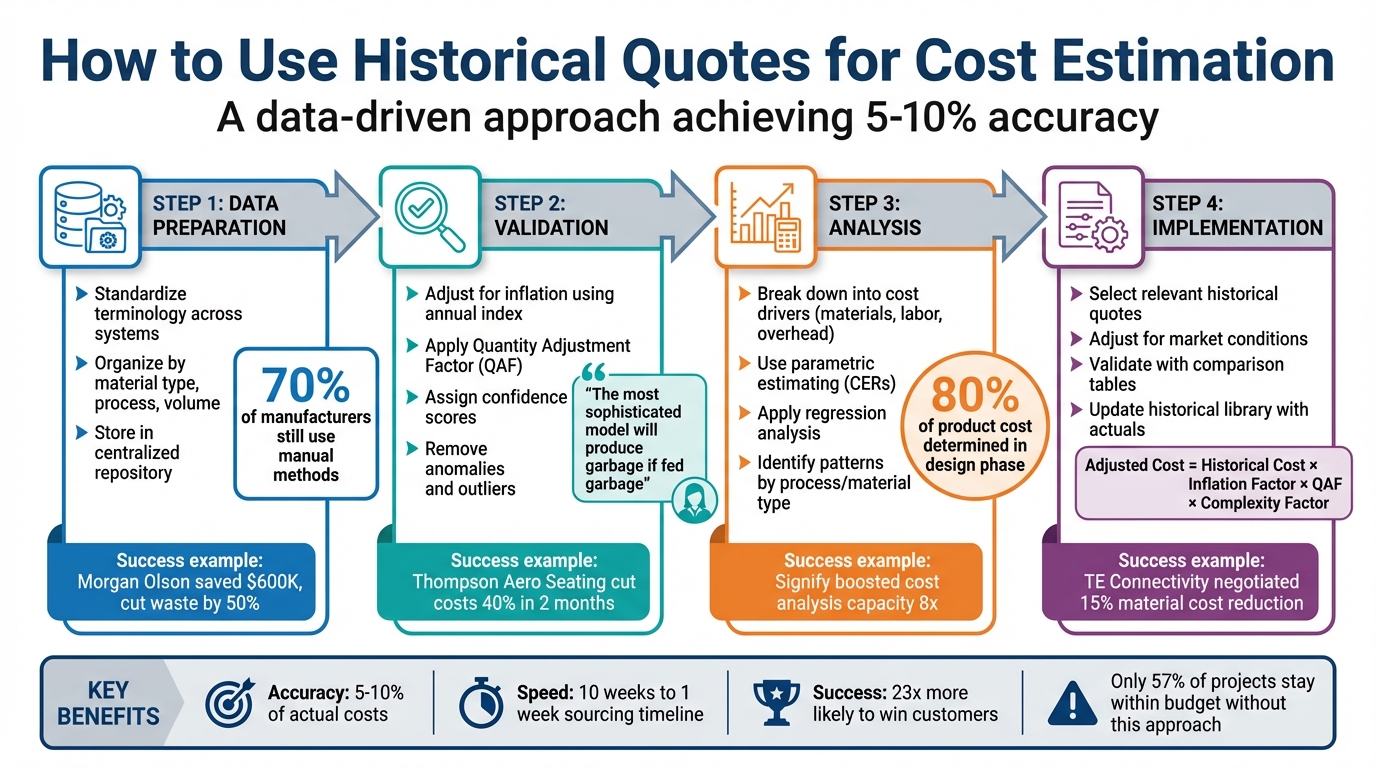
4-Step Process for Using Historical Quotes in Cost Estimation
OEM COG: How to Better Estimate and Forecast Production Costs
sbb-itb-827f251
Preparing Historical Quote Data for Cost Estimation
Historical quotes need to be cleaned and organized to create accurate cost estimates. Currently, 70% of manufacturers still rely on manual methods – often spreadsheets – to collect production data. This scattered approach makes it tough to identify trends or build reliable estimates.
Standardizing and Organizing Data
The first step is converting historical data into a consistent format. Machines, suppliers, and older systems often use different terms for the same information, which can lead to confusion. By standardizing these terms – like using "PartCount" across the board – you create a single source of truth.
"Data standardization converts the enormous volume of incoming information into a standard format." – MachineMetrics
Take Morgan Olson, for example. In 2025, this walk-in van body manufacturer used MachineMetrics to standardize its production data. The payoff? They saved $600,000 in capital expenditures and cut waste by 50%. Similarly, Flexco automated its data standardization process, boosting productivity by 16.5% and overall plant utilization by 9%.
Once standardized, organize quotes using consistent labels like material type (e.g., aluminum vs. steel), manufacturing process (e.g., CNC machining vs. injection molding), volume tiers, and complexity levels. Store this information in a centralized repository, whether that’s a dedicated analytics platform or a data warehouse. This setup makes it easy to search and compare past projects. Be sure to include key details such as labor hours, subcontractor fees, equipment costs, and risk factors like scope changes or client-driven modifications.
With your data standardized and organized, the next step is validating its accuracy and completeness.
Validating Data Completeness and Accuracy
Once the data is organized, it’s critical to verify its reliability. Start by adjusting old costs for inflation using an annual index to reflect today’s dollars. Then, apply a Quantity Adjustment Factor (QAF) to adapt prices for order quantities that differ from historical batch sizes.
Assign a confidence score to each record based on how recent it is and how closely it aligns with your current requirements. Use regression analysis to check data fit; an R-squared value near 1 indicates strong alignment, while lower values may highlight outliers or hidden costs. Remove anomalies like demand spikes or one-off events that don’t reflect typical operations.
"The most sophisticated predictive model in the world will produce garbage if fed garbage." – Elisa Industriq
Cross-check historical quotes against a "should-cost" model built from first principles – factoring in material, labor, and overhead costs. This approach can reveal missing cost drivers or gaps in supplier logic. For instance, in 2023, Thompson Aero Seating analyzed its top 50 most expensive stock machine parts using this method. By combining historical data with should-cost models during supplier negotiations, they cut costs by 40% in just two months.
Finally, ensure quotes are based on current specifications, not outdated versions. Document technical assumptions like cycle times and machine utilization. By validating these details, your historical data becomes a reliable resource for future cost estimates.
Analyzing Historical Data to Identify Trends and Patterns
After validating your historical quote data, the next step is to break it down and uncover patterns that influence costs. This process involves analyzing quotes at their core and applying statistical methods to forecast future pricing with greater precision.
Identifying Cost Drivers
Start by breaking down each historical quote into key components: direct materials, labor, overhead, SG&A, logistics, and supplier margins. This analysis helps pinpoint the factors that have the most significant impact on overall costs. Research shows that nearly 80% of a product’s total cost is determined during the early stages of design, making it essential to identify these drivers as early as possible.
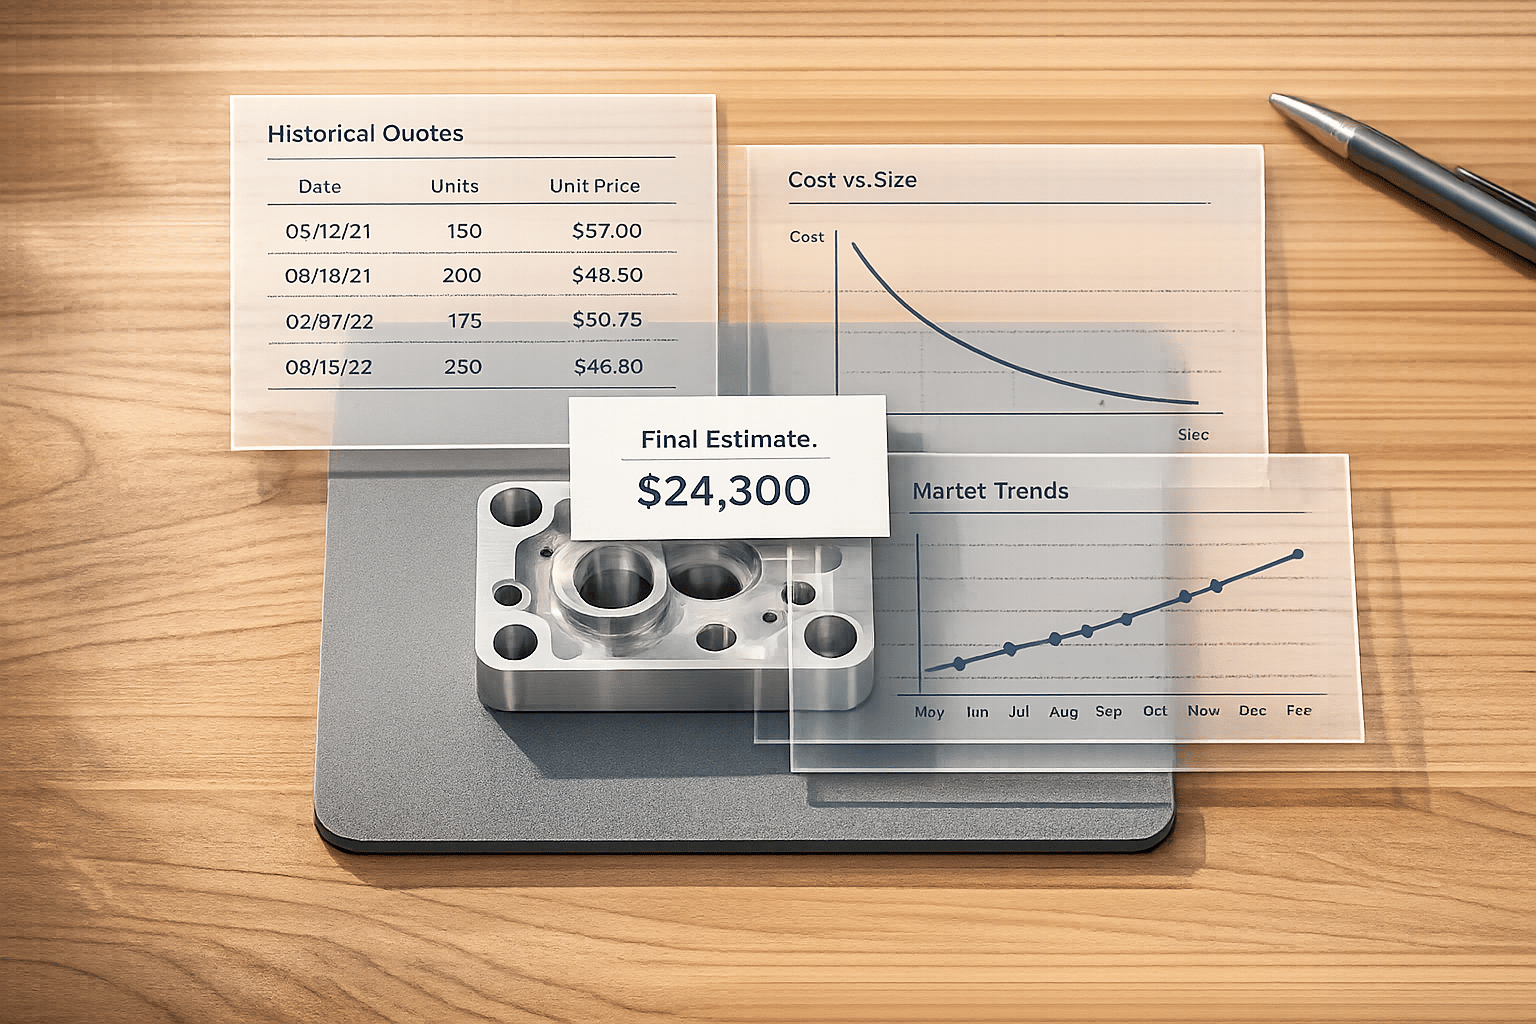
Organize the data by process type (e.g., sheet metal, casting, CNC machining) and material type (e.g., aluminum, steel, plastic). For instance, machining aluminum often requires a scrap allowance of 5–10%. Tools like "Cost vs. Mass Analysis" can highlight inefficiencies by plotting historical cost estimates against the finished weight of components. Outliers – those more than one standard deviation above the trendline – may signal design inefficiencies or hidden costs. A great example of this approach is TE Connectivity’s 2025 negotiation with a supplier. By analyzing the cost structure, they demonstrated that an energy price spike only raised product costs by 4%, not the 10% the supplier claimed. This analysis allowed them to negotiate a 15% reduction in raw material costs.
Don’t forget to account for indirect costs like setup time, tooling maintenance, and quality control inspections, as these can quietly impact profitability. When evaluating labor costs, use fully burdened rates that include benefits, payroll taxes, and insurance, rather than just base wages. Additionally, consider factors like yield rates and scrap buy-back rates to fully understand material cost drivers.
Once you’ve identified these cost drivers, the next step is to quantify their influence using statistical tools.
Using Statistical and Parametric Methods
With cost drivers in hand, advanced statistical methods can turn historical data into predictive models. Parametric estimating, for example, uses mathematical formulas – known as Cost Estimating Relationships (CERs) – to express costs as functions of measurable variables like weight, dimensions, or volume. A basic formula might look like this: Total Cost = (Cost per Unit × Number of Units) + Fixed Costs, adjusted using historical data for similar parts.
"Parametric estimating trades opinion for evidence." – MicroEstimates
Linear regression can help quantify individual cost drivers, while multiple regression models can factor in additional variables like complexity or batch size. For standardized parts with recurring variations, parametric models are faster and more consistent than manual, bottom-up estimates.
Consider the example of Signify, a global leader in lighting. In 2025, they implemented an automated procurement platform that used should-cost models for mechanical parts. This approach boosted their cost analysis capacity by eightfold, enabling them to better manage expenses across their product range. Similarly, Carrier used a cost management platform to integrate design and sourcing decisions. By identifying cost drivers early in the design phase, they anticipated saving around $30 million on key product development projects.
To ensure your models remain accurate, validate them by comparing parametric estimates with actual costs from completed projects. Regular calibration helps maintain the reliability of your predictions over time.
Applying Historical Data to Generate New Quotes
After analyzing historical data and spotting cost patterns, the next step is putting that knowledge to work. This involves choosing the most relevant past quotes, adjusting them to reflect current market conditions, and validating your estimates before finalizing them.
Selecting Relevant Historical Quotes
The foundation of accurate estimates lies in selecting historical quotes that align closely with your current project. Start by filtering past projects based on their similarity in scope, size, and complexity. For example, if you’re quoting for a CNC-machined aluminum bracket, prioritize historical quotes involving similar machining processes, materials, and part designs, rather than unrelated components.
Focus on recent data where the order size matches your current proposal. A small order from years ago won’t provide reliable insights for a larger project today. To simplify this process, implement a confidence scoring system that ranks historical records based on their age and quantity match. The highest-scoring record should guide your estimate. Use consistent labels – like differentiating between "moderate complexity" and "high complexity" – and standardized cost codes (e.g., CSI MasterFormat) to ensure meaningful comparisons. Exclude outlier projects that don’t represent typical conditions to keep your averages accurate.
Once you’ve identified the most relevant data, update those figures to reflect current market realities.
Adjusting for Current Market Conditions
Historical quotes need adjustments to account for today’s prices. Use this formula to update costs:
Adjusted Unit Cost = Historical Unit Cost × Inflation Factor × Quantity Adjustment Factor × Complexity Factor.
Start with inflation. For instance, a 2% annual inflation rate over five years results in an adjustment factor of 1.102, reflecting a 10.2% increase in costs. Next, adjust for quantity – smaller orders might carry a 20% premium, while larger ones could see a 10% discount. If your new part differs slightly from a historical one, apply a complexity factor to account for technical variations. Don’t forget to account for regional differences in labor, energy, and tariffs, as these can significantly impact costs. Also, update material pricing to match current market rates, especially if volatility has affected those costs.
For example, in 2025, TE Connectivity faced a supplier’s energy cost increase of 300%. By using precise cost estimation tools, they determined the energy spike would only raise product costs by 4%. This allowed them to challenge the supplier’s proposed 10% machine rate hike and negotiate a 15% reduction in raw material costs to offset inflation.
With these adjustments made, the next step is validating your estimates through comparisons.
Validating Estimates with Comparison Tables
Before finalizing your quote, use a comparison table to break down costs into categories like raw materials, machining, labor, logistics, and margins. This ensures a clear, like-for-like comparison between your internal estimate and supplier quotes. It also helps identify any "missing buckets", such as shipping or setup fees that could be overlooked.
"One of the biggest advantages to accounting for cost buckets is to identify any misunderstandings between your company and the supplier. It is better to find out now that the supplier has not included the shipping costs than to find out later."
- Eric Hiller, Managing Partner, Hiller Associates
Apply the "Rule of Three" by including at least three supplier quotes in your table. This approach highlights outliers that deviate from historical averages or should-cost benchmarks. For instance, in 2025, Thompson Aero Seating used a should-cost analysis on their top 50 most expensive machined parts. By comparing supplier quotes to internal benchmarks, they reduced costs by 40% in just two months.
| Cost Bucket | Internal Should-Cost | Supplier Quote A | Supplier Quote B | Variance (Internal vs. A) |
|---|---|---|---|---|
| Raw Material | $5.00 | $5.50 | $4.80 | +$0.50 |
| Machining | $10.00 | $12.00 | $11.50 | +$2.00 |
| Finishing/Paint | $2.00 | $2.00 | $2.50 | $0.00 |
| Logistics/Shipping | $1.50 | (Missing) | $1.75 | –$1.50 |
| Total Unit Cost | $18.50 | $19.50 | $20.55 | +$1.00 |
This table format simplifies spotting discrepancies, whether in your estimates or supplier pricing, ensuring you’re ready to finalize an accurate and competitive quote.
Validating and Refining Cost Estimates
Once you’ve used historical data to create new quotes, the next step is to validate and fine-tune those estimates by comparing them to actual costs. Generating a quote is just the beginning – refining your estimates involves an ongoing process of analysis and improvement. By evaluating how your estimates align with real-world costs and feeding those findings back into your historical data, you create a feedback loop that makes future quotes more accurate.
Comparing Estimates to Actual Costs
After completing a project, conduct a post-project review to pinpoint where your assumptions differed from reality. Take a close look at actual setup times, cycle speeds, and material waste to uncover errors in areas like labor hours, scrap rates, overhead allocation, and machine utilization. These insights help you identify the "noise" in your estimates, whether it’s due to market fluctuations, supplier risks, or internal inefficiencies.
Keep an eye on variances in materials, labor, and overhead. For example, even with a should-cost estimate of $100, actual costs might range from $71 to $132 – a variance of almost 30%. Supplier quotes for the same part can swing by 40% or more depending on market conditions. Understanding these variations allows you to refine your formulas and set realistic confidence ranges.
"The goal of the should cost estimate is not to get the most accurate cost but to serve as a valuable point of comparison between the assumed and actual prices." – Chris Jeznach, Product Marketing Lead, aPriori
Document every deviation thoroughly, noting which cost drivers – like machine utilization, labor categories, or unexpected material price changes – caused the largest gaps. Use this information to improve your parametric models. When actual order volumes differ from your historical baseline, apply quantity adjustment factors to account for these differences. These documented insights become the foundation for updating your historical data library, ensuring continuous improvement.
Updating Historical Data Libraries
Integrate actual costs and lessons learned from each project into your historical database. This feedback loop keeps your data accurate and relevant, directly enhancing the processes outlined in "Preparing Historical Quote Data" and "Analyzing Historical Data to Identify Trends and Patterns." Start by cleansing your data – correct errors, remove outliers, and resolve inconsistencies before adding new information to your library.
Standardize your data by using consistent labels for project types, complexity levels, and resource categories. This makes it easier to compare costs across different time periods and ensures your team works with the same validated data sources. Update your datasets at least quarterly, as relying on data that’s even a year old can lead to errors due to market shifts. For volatile costs like raw materials and commodities, supplement your records with real-time market data instead of relying solely on static historical figures.
"Using live data is essential. Commodity prices change quickly, and an estimate from last quarter can cost you significantly in a negotiation." – MicroEstimates
Centralize your data in a cloud-based platform to avoid version control issues and ensure all stakeholders access the same "version of the truth." Research shows that only 57% of projects are completed within their original budgets, often because of inaccurate estimates. By consistently refining your historical library with validated data, you reduce this risk and create a more reliable quoting process. Over time, this approach improves the accuracy of your cost estimates and makes your quoting system more competitive and predictable.
Using Quoting Software for Advanced Cost Estimation
Modern quoting software has reshaped how manufacturers manage historical data. Instead of relying on scattered spreadsheets, these tools centralize and automate data storage, bringing together past bids, project results, and performance metrics into a single, organized system. This approach eliminates the inconsistencies that often occur with manual methods. Over time, the system learns from each project, refining future estimates and laying the groundwork for advanced analytics and real-time updates.
Automating Analysis with Advanced Analytics
Advanced quoting platforms take analysis to the next level by working directly with 3D CAD geometry. They can instantly estimate costs and assess manufacturability, pinpointing cost drivers early in the design process. This early-stage insight is crucial for keeping costs under control. Additionally, bulk costing capabilities allow manufacturers to analyze multiple parts or assemblies simultaneously, uncovering cost-saving opportunities across an entire portfolio.
Integrating Real-Time Market Data
Relying solely on static historical data can lead to outdated estimates. Modern quoting software addresses this by integrating with ERP and CRM systems to provide real-time updates on material prices, labor rates, and overhead costs.
Take this example: A manufacturer faced skyrocketing production costs, including a 300% jump in energy expenses and a 30% increase in overall production costs. By leveraging real-time cost data, they entered fact-based negotiations with suppliers. The result? A 15% reduction in raw material costs and proof that a supplier’s proposed 10% machine rate increase only raised product costs by 4%.
Platforms like QSTRAT (https://qstrat.com) enhance this process by enabling direct communication with suppliers. This ensures material costs in estimates are always current and verified. By streamlining supplier data collection and eliminating the need to log into multiple portals, companies save time. Plus, responding quickly to RFQs can boost win rates by as much as 50%.
Improving Supplier Collaboration
Quoting software doesn’t just improve data accuracy – it also transforms how teams and suppliers communicate. Instead of relying on long email threads or phone calls, these platforms use system-generated requests and responses to create a structured communication channel. This ensures suppliers provide timely and accurate pricing information. When suppliers update their pricing or lead times, the system flags affected quotes for review, keeping everything consistent and accurate.
Centralized platforms also give all stakeholders – whether estimators, engineers, procurement teams, or suppliers – access to the same validated data. This "single version of the truth" eliminates version control issues. Additionally, as actual production costs are recorded, the system compares them with original estimates, automatically updating the historical library to improve future accuracy.
Conclusion
Historical quote data takes cost estimation from a guessing game to a precise, data-driven process. By centralizing past project details – like labor hours, material costs, and supplier performance – manufacturers can create estimates that are typically within 5–10% of actual costs. This level of accuracy is crucial, as relying on outdated information or gut instincts often leads to budgets spiraling out of control.
Switching from reactive quoting to a data-driven sourcing approach delivers real, measurable benefits. Companies leveraging historical benchmarks can cut sourcing timelines from 10 weeks to just one. Additionally, manufacturers using data-driven methods are 23 times more likely to win new customers compared to those relying solely on intuition. Beyond speed, historical data transforms negotiations, replacing vague price discussions with focused conversations about specific cost drivers such as materials, labor rates, and machine hours.
"Effective sourcing isn’t just about securing materials – it’s about shaping the future trajectory of manufacturing excellence." – John Dickey, QSTRAT
Modern quoting tools, like QSTRAT (https://qstrat.com), take these advantages even further by automating the collection and analysis of historical data. These tools integrate costing information from ERP systems and Bills of Materials into a single source of truth. Using AI, they compare new quotes against historical data to flag outliers, eliminating the need for fragmented spreadsheets and manual data entry. By building on the strategies discussed earlier, this technology ensures estimates are always aligned with the latest market trends and past performance.
FAQs
How many past quotes do I need to start estimating?
When it comes to analyzing past quotes, there’s no magic number to aim for. However, reviewing several relevant and recent quotes can significantly boost accuracy. Typically, starting with a handful of comparable quotes is enough to build a reliable foundation. The exact number you’ll need depends on factors like the complexity of your project and how much data you have access to. That said, having more data usually leads to a stronger baseline for estimating costs and resources.
What should I do when old quotes don’t match today’s specs?
When existing quotes no longer reflect current specifications, it’s time to revisit and adjust them. Factor in today’s material prices, updated technical needs, and supplier conditions to ensure accuracy. A smart way to tackle this is by using a data-driven approach, such as should-cost analysis. This method helps break down and reassess key cost components like materials, labor, and logistics.
To make the process smoother, tools like QSTRAT can be invaluable. They simplify the task of aligning quotes with up-to-date specs and market realities, saving time while maintaining accuracy.
How do I validate my estimate before sending a new quote?
To ensure your estimate is solid, take a close look at the cost structure for accuracy and clarity. Break it down into key components like materials, labor, overhead, and logistics. Double-check that all assumptions match up with historical data and are clearly documented.
Go the extra mile by cross-referencing key inputs, confirming they’re consistent, and making sure the cost drivers make sense. Using digital tools – such as centralized quoting platforms – can simplify this process, reduce mistakes, and give you a dependable base for your final quote.
Related Blog Posts
You may also like

Top 7 Tools For Supplier Relationship Management
Compare seven SRM platforms by features, integrations, and scalability to find the right supplier management solution.

Supplier Certification: Why It Matters for Compliance
Supplier certification is a strategic safeguard that prevents regulatory breaches, supply disruptions, and reputational damage.