
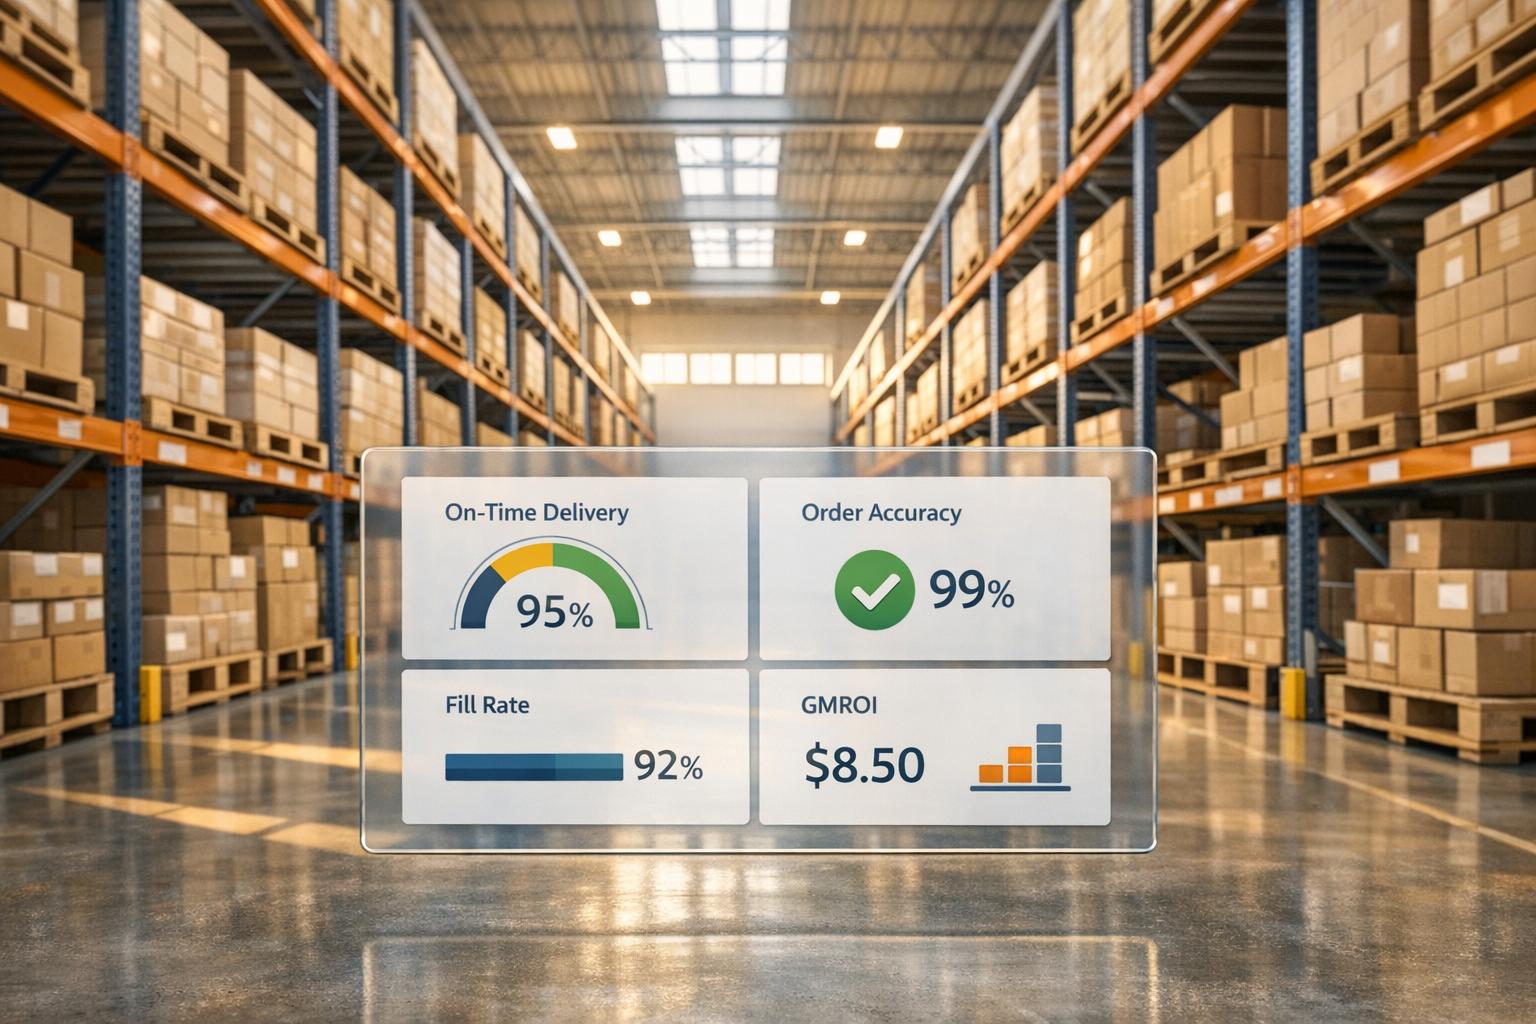
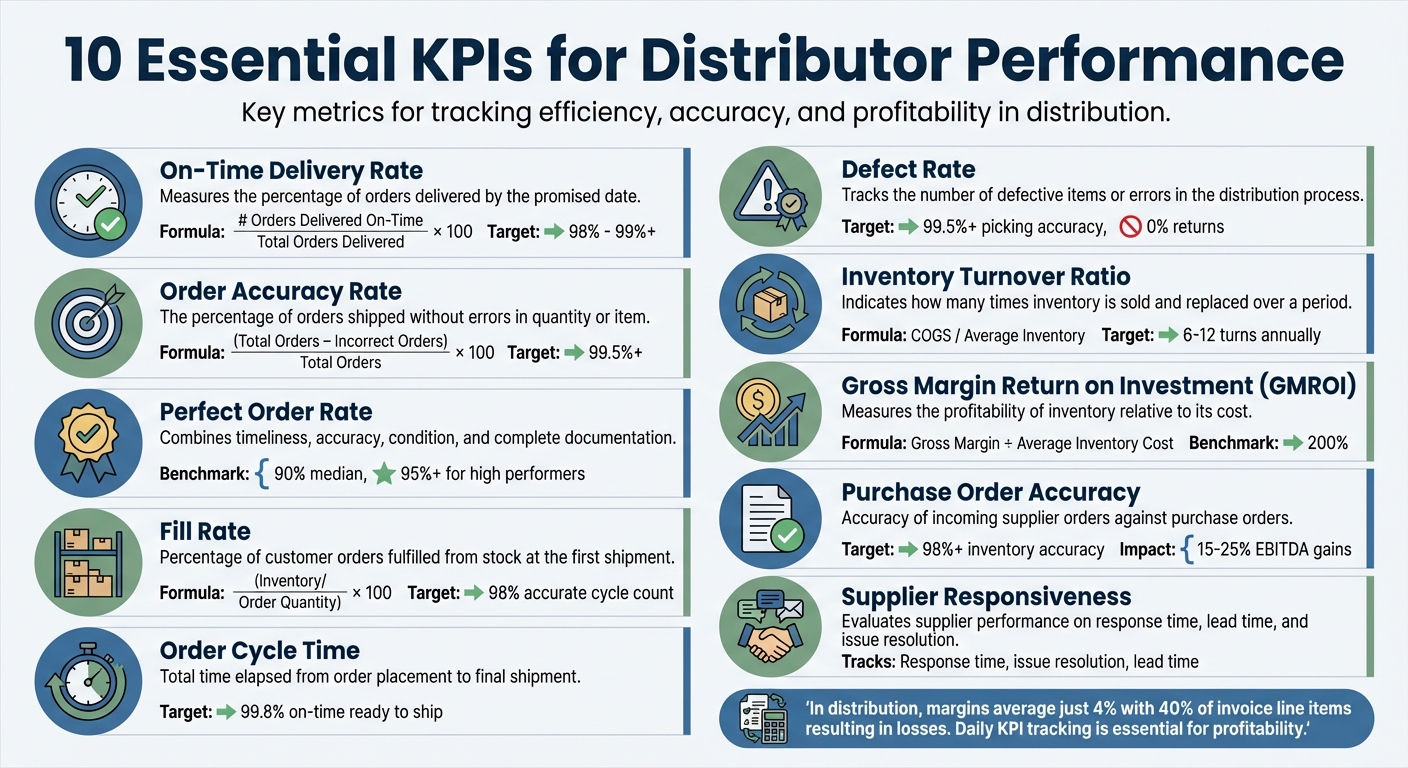
Running a distribution business without tracking performance metrics is risky. Key Performance Indicators (KPIs) help distributors monitor efficiency, reduce costs, and improve customer satisfaction. This article highlights 10 critical KPIs every distributor should track:
- On-Time Delivery Rate: Measures how often orders are delivered on schedule.
- Order Accuracy Rate: Tracks the percentage of error-free orders.
- Perfect Order Rate: Combines timeliness, accuracy, and condition of delivered orders.
- Fill Rate: Assesses inventory’s ability to meet order demand.
- Order Cycle Time: Tracks the time from order placement to shipment.
- Defect Rate: Measures errors in shipments, such as damaged or incorrect items.
- Inventory Turnover Ratio: Evaluates how efficiently inventory is sold and replenished.
- Gross Margin Return on Investment (GMROI): Analyzes profitability from inventory investments.
- Purchase Order Accuracy: Tracks how well received items match purchase orders.
- Supplier Responsiveness: Measures supplier efficiency in addressing issues and fulfilling orders.
These KPIs provide actionable insights to improve distributor performance, cut costs, and strengthen customer trust. Monitoring them daily ensures timely adjustments and supports better decision-making.
10 Essential KPIs for Distributor Performance Tracking
WEBINAR: Top 10 Distribution KPIs – And Why They Matter
sbb-itb-827f251
Why KPIs Matter for Distributors
Tracking KPIs changes the game for distributors by replacing guesswork with solid, data-driven insights. As Bizowie aptly describes:
"Running a distribution business solely on gut feel and anecdotal evidence is like flying a plane without instruments".
Without reliable metrics, decisions hinge on intuition rather than facts – a risky approach in an industry where margins are razor-thin. Leveraging data enables distributors to tackle operational delays and refine their execution strategies.
One standout benefit of KPIs is their ability to solve the "lag problem." Unlike monthly reports that arrive too late to act on, daily operational KPIs provide real-time visibility. This allows distributors to spot emerging trends early and address them before they spiral into major issues.
Another key advantage is the shift from tracking activity to assessing execution. Metrics like total orders processed may not reveal much, but focusing on indicators like perfect order rate or product-line gross margin highlights service quality issues or operational bottlenecks. This deeper insight empowers distributors to fine-tune processes and improve over time.
KPIs also foster alignment and accountability across departments. When warehouse, sales, and finance teams track the same metrics, they gain a unified understanding of how their efforts impact overall business goals. This shared focus encourages collaboration and builds a results-driven culture where teams take responsibility for outcomes, not just tasks.
These operational enhancements directly impact crucial metrics like perfect order rates and delivery performance. David Saunders from Ultra Consultants underscores the importance:
"In a low margin business such as distribution, how effectively you use all your assets can be the difference between being profitable and not".
In simpler terms, efficient asset utilization is critical for profitability. High-performing distributors aim for benchmarks such as a 95% perfect order rate and 99.5% picking accuracy. Achieving these standards requires focusing on the right metrics and acting decisively on accurate data insights.
1. On-Time Delivery Rate
Relevance to Distributor Performance
On-Time Delivery (OTD) is a key metric for tracking how efficiently distributors fulfill orders. It’s calculated as: (# Orders Delivered On-Time / Total Orders Delivered) × 100. This percentage reflects the distributor’s ability to meet deadlines and highlights areas for process improvement. For shipments that don’t arrive in full, a related metric, On-Time Delivery In-Full (OTIF), provides additional clarity. While OTD focuses on whether the shipment made it by the deadline, OTIF measures if the entire order arrived on time without any missing items.
Ability to Improve Customer Satisfaction
Timely deliveries are essential for keeping customers happy. When orders arrive as expected, it fosters trust and encourages repeat business. As Kissinger Associates explains:
"Timeliness is one of the most critical factors in customer satisfaction for distributors. If orders are frequently delayed, customers may choose to switch to competitors".
A high OTD rate builds loyalty, while frequent delays can frustrate customers, increase service inquiries, and push them toward more reliable alternatives.
Alignment with Cost Efficiency Goals
Tracking OTD doesn’t just improve customer satisfaction – it also helps cut costs. Higher OTD rates mean fewer complaints, reduced RMAs (Return Merchandise Authorizations), and less reliance on costly expedited shipping. It also serves as a predictive measure for gauging customer retention and satisfaction. By monitoring OTD daily, distributors can spot bottlenecks early and address them before they escalate into larger problems.
2. Order Accuracy Rate
Relevance to Distributor Performance
Order accuracy rate reflects how well a distributor fulfills orders without mistakes. The formula is simple: (Total Orders – Incorrect Orders) / Total Orders × 100. This metric is a strong indicator of how effectively a distributor handles its order fulfillment process. Top-tier distribution companies boast an impressive 99.8% order picking accuracy, while many high-performing operations aim for at least 99.5%.
Impact on Operational Efficiency
Achieving high accuracy rates helps avoid costly issues like returns, restocking, and re-shipping. By monitoring errors in picking, packing, and shipping, businesses can pinpoint where inefficiencies and waste occur. Identifying these problem areas early allows companies to make targeted improvements, directly boosting operational performance.
Ability to Improve Customer Satisfaction
Beyond operational benefits, high order accuracy plays a big role in keeping customers happy. Kelly Squizzero from Acumatica highlights this connection:
"A high order accuracy rate reduces cost by minimizing returns/exchanges, boosts customer satisfaction"
Errors in orders are a major source of customer complaints and can even drive clients away permanently. With many business customers now expecting error-free deliveries similar to what they experience with Amazon, order accuracy has become a key way to stand out in the market.
Alignment with Cost Efficiency Goals
Every order mistake comes with a price – extra shipping fees, labor for handling returns, and potential product losses all chip away at profits. As Kissinger Associates explains:
"Inaccurate orders can lead to costly returns, extra shipping expenses, and even the loss of clients due to dissatisfaction."
Maintaining high accuracy not only cuts these costs but also builds trust with customers. Tools like barcode scanning and RFID technology can reduce manual errors during picking and packing, safeguarding profit margins. In this way, ensuring order accuracy supports both financial goals and customer relationships, cementing its importance in distributor performance.
3. Perfect Order Rate
Relevance to Distributor Performance
The Perfect Order Rate tracks how often orders are delivered without any issues – on time, complete, undamaged, and with accurate documentation. It’s calculated by multiplying the percentages of each component (on-time delivery, order completeness, damage-free condition, and documentation accuracy) and then multiplying the result by 100. According to the DC Measures benchmarking study, the median perfect order probability stands at 90%. This metric goes beyond individual KPIs, offering a broad view of how effectively fulfillment processes are running.
Impact on Operational Efficiency
Expanding on metrics like the Order Accuracy Rate, the Perfect Order Rate evaluates all key performance areas. By breaking performance into four critical components – timeliness, completeness, condition, and documentation – it helps pinpoint operational issues early. Thomas Fitzgerald from Earnest Associates highlights that “a high perfect order rate is a strong indicator of overall operational health”. With the rise of autonomous warehouses, this metric has seen improvement as automation reduces human errors in processes like picking and documentation.
Ability to Improve Customer Satisfaction
A strong Perfect Order Rate directly impacts customer satisfaction. When customers receive the correct items, on time, and in good condition, it fosters trust and encourages repeat business. This is particularly vital since 43% of online shoppers say fast and reliable delivery is the most critical part of their buying experience. Consistently delivering perfect orders helps distributors establish a reputation for reliability, strengthening customer loyalty.
Alignment with Cost Efficiency Goals
Mistakes in orders lead to extra costs, such as return shipping fees, rework labor, and lost product value due to damage. Improving the Perfect Order Rate minimizes these costs while boosting customer loyalty. Distributors can address inefficiencies by standardizing packing procedures, introducing quality checks at multiple stages, and closely monitoring supplier performance to catch problems early. Incorporating perfect order tracking into daily operations allows for real-time adjustments. These efforts not only cut costs but also enhance overall operational effectiveness, making KPI monitoring an essential tool for distributors aiming to optimize performance.
4. Fill Rate
Relevance to Distributor Performance
Fill rate is a critical metric for assessing a distributor’s ability to meet immediate order demands using available inventory. It’s calculated as (Inventory / Order Quantity) × 100 and serves as an indicator of how effectively you’re meeting market needs. According to Thomas Fitzgerald from Earnest & Associates, "Low fill rates can signal issues in forecasting, procurement, or inventory management". To avoid problems like high back-order rates or missed sales opportunities, distributors often aim for a 98% accurate cycle count. This metric doesn’t just reflect customer service capabilities – it also provides insight into operational performance.
Impact on Operational Efficiency
A drop in fill rates can act as an early warning sign for underlying inefficiencies, even before they show up in monthly reports. That’s why it’s smart to integrate fill rate tracking into daily dashboards instead of relying solely on end-of-month reviews. Monitoring fill rates by SKU or product category offers a clearer picture of what’s driving stockouts or excess inventory. This approach allows you to pinpoint specific problems – like supplier delays or inaccurate demand forecasts – without resorting to blanket increases in stock levels.
Ability to Improve Customer Satisfaction
Being able to fulfill customer orders directly from stock is key to maintaining high service levels and building customer loyalty. With growing expectations for fast, Amazon-like delivery times, fill rate has become a major competitive factor. A strong fill rate demonstrates that your demand planning and restocking processes are on point, minimizing the need for backorders or costly rush shipments.
Alignment with Cost Efficiency Goals
Achieving high fill rates while managing inventory costs is a balancing act. As Bizowie points out, "Balancing fill rate with inventory investment represents one of distribution’s core challenges". While high fill rates are important, overstocking slow-moving items drives up carrying costs. Instead, optimizing reorder points based on demand trends can help. Leveraging historical data for better forecasting and negotiating reliable supplier agreements ensures consistent replenishment, helping you maintain strong fill rates without tying up unnecessary capital.
5. Order Cycle Time
Why It Matters for Distributor Performance
Order cycle time tracks how long it takes from when an order is placed to when it’s shipped. This metric is a key indicator of how efficiently your operations run and how well you meet customer expectations. Unlike financial metrics that look at past performance, this one gives you a real-time look at your operational health. Simply put, shorter order cycle times mean your processes are working better. It’s also a great starting point for identifying delays in your workflow. David Saunders, Senior Consultant at Ultra Consultants, highlights its importance:
"TOCT has become an important KPI as business customers have come to expect Amazon-like delivery timeframes".
How It Boosts Operational Efficiency
Monitoring order cycle time helps uncover where things might be slowing down in your fulfillment process. This is especially important when you consider that labor costs can eat up 10%-20% of your revenue. Fixing inefficiencies in distribution – like cutting down order cycle times – is often more cost-effective than trying to optimize manufacturing. By identifying and addressing delays, you can use your current resources to handle more orders without adding extra costs. This improvement naturally ties into how speed affects customer satisfaction.
Meeting Customer Expectations
Today’s B2B customers expect quick and dependable deliveries. In fact, 43% of customers prioritize fast, reliable shipping, and nearly half will abandon their purchase if delivery takes longer than six days. Faster cycle times not only set you apart from competitors but also help build customer loyalty. Top-tier operations aim for an "On-Time Ready to Ship" rate of 99.8%, while anything below 93.4% signals a need for significant improvement. Speeding up your order processing doesn’t just keep customers happy – it also reduces operational costs.
Tying It to Cost Efficiency
Shorter order cycle times don’t just improve customer satisfaction – they also save money. By speeding up the process, you free up working capital that would otherwise be stuck in unshipped orders. This efficiency increases profitability by cutting labor and handling costs. Tools like real-time cloud ERP systems make it easier to monitor and address delays quickly. When combined with other metrics, reducing order cycle time creates a clear path to better financial performance, showing how data-driven improvements can make a tangible difference.
6. Defect Rate
Relevance to Distributor Performance
Defect rate tracks how often errors occur when orders leave your warehouse – whether it’s shipping the wrong product, sending damaged goods, or including incorrect documentation. Top-performing distributors target a picking accuracy of 99.5% or higher, with the ultimate goal of 0% returns due to shipment errors. Achieving these benchmarks reflects a well-oiled operation. As insightsoftware notes:
"The perfect order rate KPI measures the number of orders delivered from the distribution center without any kind of error."
This metric not only gauges operational precision but also highlights its ripple effects on customer satisfaction and efficiency.
Impact on Operational Efficiency
Every defective order creates a chain reaction of extra work – handling RMAs, issuing credits, or reworking shipments. To avoid these disruptions, maintaining an inventory accuracy of at least 98% is essential. Tools like barcode scanners and RFID technology reduce human error during picking and packing, while quality control checkpoints catch mistakes before they escalate. Conducting root cause analyses can uncover patterns, whether tied to specific products or departments, allowing you to address recurring issues at their source.
Ability to Improve Customer Satisfaction
In an era where 43% of online shoppers value fast and reliable deliveries, even minor defects can cost you customers. Kissinger Associates emphasizes the stakes:
"Inaccurate orders can lead to costly returns, extra shipping expenses, and even the loss of clients due to dissatisfaction."
High-performing distributors aim for a Perfect Order Rate of 95% or higher, which builds the trust and dependability that keep customers loyal. Reliable operations not only enhance satisfaction but also strengthen your reputation in a competitive market.
Alignment with Cost Efficiency Goals
Defects come with a price – extra freight, labor, and even lost inventory – all of which eat into your margins. Bizowie outlines the financial toll:
"Every fulfillment error costs money directly through freight, labor, and potentially lost product, plus damages customer trust and satisfaction."
These hidden costs, often referred to as margin leakage, can significantly impact profitability. Since picking and packing expenses are variable, reducing defects is one of the most straightforward ways to protect your bottom line. By minimizing errors, you not only improve cost efficiency but also support leaner, more profitable operations for your distribution business.
7. Inventory Turnover Ratio
Relevance to Distributor Performance
The inventory turnover ratio measures how often stock is sold and replenished within a given period. It’s calculated by dividing the Cost of Goods Sold (COGS) by the Average Inventory. Since inventory often represents a major portion of working capital, this metric provides insight into how effectively those assets are managed. As Ultra Consultants points out:
"In a low margin business such as distribution, how effectively you use all your assets can be the difference between being profitable and not."
For most distributors, the ideal target is 6 to 12 inventory turns annually, though this can vary depending on the product category. A higher turnover rate typically signals robust demand and efficient inventory practices, while lower rates may indicate overstocking or declining interest in certain products. This makes the inventory turnover ratio a key metric for distributors aiming to maximize efficiency and align with market needs.
Impact on Operational Efficiency
A faster turnover rate directly supports operational flexibility. By monitoring product movement, you can refine purchasing strategies and focus resources on high-demand items, which bring quicker returns. As Kissinger Associates explains:
"Efficient inventory turnover allows you to keep up with market trends, minimize holding costs, and free up working capital."
Using tools like ERP systems, you can identify slow-moving items – those sitting for 90, 180, or even 365 days. Addressing these stagnant products through promotions or liquidation helps prevent further loss of value over time.
Alignment with Cost Efficiency Goals
From a financial standpoint, unsold inventory incurs ongoing costs for storage, insurance, utilities, and depreciation, all of which erode profit margins. Bizowie warns:
"Slow-moving inventory represents cash trapped in assets that may never convert to sales."
Improving inventory turnover helps reduce these carrying costs and minimizes risks like obsolescence or spoilage. Industry benchmarks show that foundational distributors often achieve fewer than 5.9 turns annually, competitive ones average around 5.9 turns, best-in-class businesses reach 7.3 turns, and top performers hit 9 or more turns.
8. Gross Margin Return on Investment
Relevance to Distributor Performance
Gross Margin Return on Investment (GMROI) is a key metric that helps distributors fine-tune their operations and manage costs effectively. It measures the gross margin earned for every dollar invested in inventory, showing how well your inventory contributes to profitability. The formula is simple: Gross Margin ÷ Average Inventory Cost. For distributors working with tight margins, improving GMROI is critical for maintaining financial stability. As Paul Erickson from RMSA Retail Solutions puts it:
"GMROI is a key metric for protecting your cash flow. Many retailers protect their margins… but remember that you can live for a while without profits. You can’t live without cash flow."
A GMROI of 200% is often seen as a good benchmark for retail and distribution businesses, though actual performance standards vary by industry. For instance, top-performing distributors in the NAHAD 2024 report achieved gross margins of 45%, compared to an average of 35% for others. This kind of information is invaluable when identifying inefficiencies in inventory management.
Impact on Operational Efficiency
From an operational perspective, GMROI sheds light on slow-moving inventory that may be tying up valuable capital. This data can help businesses decide whether to promote, discount, or discontinue underperforming products. Unlike inventory turnover, which focuses on the speed of stock movement, GMROI looks at the profitability of that movement. A product might have low margins but high turnover – or vice versa – and still contribute positively to GMROI. As Erickson explains:
"A low GMROI tells you if a product is either moving too slowly, has insufficient margin, or both."
For more accurate insights, it’s better to analyze GMROI at the category or SKU level rather than relying solely on company-wide averages. Using ERP systems to highlight and promote higher-margin items can further improve overall GMROI for your inventory portfolio.
Alignment with Cost Efficiency Goals
Improving GMROI aligns closely with broader cost efficiency objectives. By increasing GMROI, businesses can reduce holding and storage costs through faster inventory turnover. Strategic pricing that balances profitability with sales velocity can also enhance GMROI. Additionally, securing better supplier terms to lower the Cost of Goods Sold (COGS) can significantly boost GMROI, especially for high-volume items. Accurate demand forecasting is another essential factor – it ensures high-demand products remain available, minimizing the risk of lost sales due to stockouts. To maximize GMROI, it’s critical to integrate insights from cost analysis, inventory trends, and supply chain performance.
9. Purchase Order Accuracy
Relevance to Distributor Performance
Keeping tabs on purchase order accuracy is just as important as monitoring order accuracy. This metric measures how well received items match the ordered quantities and specifications, ensuring that physical inventory aligns with expectations. When purchase orders are inaccurate, the ripple effects can include backorders, unhappy customers, and higher costs. Michael Glover from Legacy SCS highlights this issue:
"A high rate of inventory inaccuracy can result in unexpected back orders, dissatisfied customers and, ultimately, higher overall costs."
To minimize these problems, distributors should aim for at least 98% inventory accuracy. Falling short of this target can lead to stockouts and delays in order cycles. On the flip side, organizations leveraging data-driven analytics to track distribution metrics have reported EBITDA gains of 15% to 25%.
Impact on Operational Efficiency
Errors during receiving can clog up staging areas, slow down put-away processes, and disrupt workflows. However, automation tools like barcode scanners or RFID systems can significantly cut down on these errors while also reducing labor costs. For instance, Averitt Express replaced its manual, paper-based system with an automated warehouse management solution. The result? A 25% drop in labor costs and a savings of 60 hours in daily order-picking time.
When purchase orders are accurate, operations run more smoothly, with less time wasted on costly rework. Regular cycle counts also help ensure digital records match the physical inventory, keeping everything in sync. These operational improvements contribute directly to achieving broader cost-saving objectives.
Alignment with Cost Efficiency Goals
Accurate purchase orders don’t just streamline operations – they also help control costs tied to returns, exchanges, and error corrections. As Kissinger Associates points out:
"Inaccurate orders can lead to costly returns, extra shipping expenses, and even the loss of clients due to dissatisfaction."
10. Supplier Responsiveness
Relevance to Distributor Performance
Supplier responsiveness reflects how quickly and effectively suppliers handle inquiries, resolve quality issues, and adjust orders when needed. It’s a key indicator of future operational health. As SourceDay states:
"Reliable suppliers are the backbone of operational efficiency and product quality."
Key metrics to monitor include average response time to communications, the time taken to resolve quality concerns, and lead time for order changes. Another crucial metric is Total Order Cycle Time (TOCT) – the time it takes suppliers to fulfill purchase orders. Comparing this to industry benchmarks can reveal areas for improvement. In an era where customers expect "Amazon-like" delivery speeds, supplier responsiveness directly impacts your ability to meet those demands. This metric complements internal KPIs by shedding light on external factors influencing distributor performance.
Impact on Operational Efficiency
Quick supplier responses are essential for preventing supply chain disruptions from spiraling into larger issues. Fast resolutions help keep production schedules intact and mitigate bottlenecks. Bizowie highlights this:
"The faster you identify problems, the less damage they cause and the lower the cost to fix them."
Responsive suppliers also help maintain balanced inventory levels, avoiding the costs of overstocking or the reputational risks of stockouts. Leveraging ERP systems to set up automated alerts for late shipments or low-stock situations can provide real-time visibility. This allows for swift corrective actions, protecting both operational flow and customer relationships.
Ability to Improve Customer Satisfaction
Supplier responsiveness plays a critical role in delivering "perfect orders" – those that are complete, accurate, on time, and undamaged. Accurate and timely shipments from suppliers are foundational to achieving high picking accuracy rates, often targeted at 99.5% or better by top-performing distributors.
Rather than focusing on isolated data points, track trends in supplier responsiveness over time. If performance declines, a root cause analysis can help determine whether the issue lies in the supplier’s internal processes or communication gaps. Incorporating these metrics into daily routines, like morning team meetings, ensures they remain actionable rather than being relegated to monthly reviews.
Alignment with Cost Efficiency Goals
Responsive suppliers can significantly lower carrying costs and free up working capital. They also help minimize expenses tied to expedited shipping, emergency orders, and production delays caused by late or missing materials. Monitoring these metrics allows you to prioritize suppliers who enhance efficiency and identify those costing you through slow turnarounds.
Set benchmarks using your historical data and focus on tracking percent changes to measure progress. By quantifying supplier responsiveness, you can refine your strategies for operational efficiency, cost management, and customer satisfaction – all essential elements of a strong performance framework.
How QSTRAT Helps Track Distributor KPIs

Tracking distributor KPIs can be a challenge, especially when relying on manual processes that disrupt the flow between quoting, sourcing, and execution. QSTRAT’s cloud-based platform eliminates these inefficiencies by automating the entry of awarded business into your ERP system and validating supplier submissions – no need for portal logins or spreadsheets. This reduces manual errors and ensures smoother operations. The platform’s decision support tools provide instant access to supplier responses, with built-in comparison features that make it easy to identify vendors who consistently meet benchmarks for on-time delivery and quality. This is particularly critical in industries like aerospace, medical devices, and automotive, where production delays or defects can have serious consequences for compliance and operational performance.
QSTRAT also integrates complex cost factors – such as customs duties and logistics – directly into the quoting process. This ensures that pricing aligns with realistic delivery timelines, helping you protect your gross margin return on investment. By automating these details, the platform speeds up order approvals and simplifies tracking throughout the quoting process.
Centralized review and approval workflows further cut down on order cycle times by reducing the back-and-forth typically involved in finalizing quotes. Features like automatic PDF integration and a secure quoting library make it easy to track supplier contributions in one place.
For distributors, where margins are tight – averaging just 4% – and nearly 40% of invoice line items result in losses, automation is a game-changer. QSTRAT bridges the gap between CRM and ERP systems, ensuring customer requests flow seamlessly into fulfillment. This real-time integration provides visibility into critical KPIs like fill rates, perfect order rates, and inventory turnover. By transforming KPI tracking into a daily operational tool rather than a periodic review, QSTRAT helps distributors turn insights into immediate action, boosting overall performance.
Conclusion
Tracking distributor KPIs turns guesswork into clear, actionable insights. As Bizowie aptly puts it:
"Running a distribution business on gut feel and anecdotal evidence is like flying a plane without instruments".
In an industry with tight margins, spotting problems early can make the difference between steady growth and shrinking profits. Moving from monthly financial reviews to daily operational dashboards has reshaped how top distributors stay ahead. Instead of waiting weeks to uncover issues like thinning margins or slipping service levels, real-time KPI tracking offers early alerts, enabling quick adjustments. This approach unites teams across finance, sales, and warehouse operations, ensuring everyone understands how their efforts contribute to the bottom line.
Modern tools, such as QSTRAT, automate data collection from ERP systems and centralize dashboards, making KPI tracking a daily habit rather than an occasional task. This shift leads to faster problem-solving, stronger margins, and better customer satisfaction through consistent delivery performance.
For distributors aiming for goals like 98% inventory accuracy, 99.5% picking accuracy, or 6 to 12 inventory turns annually, automation bridges the gap between insight and action. Real-time monitoring and exception alerts shift the focus from simply tracking metrics to actively driving results. In a competitive market where even small improvements matter, these streamlined processes not only improve operations but also strengthen customer relationships.
FAQs
Which KPIs should I track first?
Tracking key performance indicators (KPIs) such as fill rate, order cycle time, and inventory carrying cost is a smart first step. These metrics give you valuable insights into how efficiently your operations are running and how well you’re meeting customer expectations. Paying attention to these early on can spotlight areas that need adjustment, helping you fine-tune your distribution processes for smoother performance.
How often should distributor KPIs be reviewed?
Distributor KPIs need regular reviews to spot problems early and make smarter decisions. Experts often suggest checking critical metrics daily or conducting reviews at least monthly to maintain steady performance and keep track of progress.
How can I set KPI targets for my business?
To set KPI targets, start by pinpointing the metrics that align closely with your objectives – think order accuracy, delivery times, or cost efficiency. Use your current performance data to establish a baseline, and then set targets that are both measurable and achievable. Refer to industry benchmarks to ensure your goals are competitive, but keep them realistic given your resources and capabilities. Consistently track your progress and fine-tune these targets over time to ensure steady improvement.
Related Blog Posts
You may also like

Top 7 Tools For Supplier Relationship Management
Compare seven SRM platforms by features, integrations, and scalability to find the right supplier management solution.

Supplier Certification: Why It Matters for Compliance
Supplier certification is a strategic safeguard that prevents regulatory breaches, supply disruptions, and reputational damage.